What is this package?
This package simplifies plotting geospatial data on top of a base map. It is intended to make plotting easy and uniform across multiple applications, while remaining flexible with options for changing the map projection, domain, plotting levels, and more. It’s capable of plotting multiple fields as well.
How do I plot data?
In cpc.geoplot a Geomap object defines how the map will look. It contains attributes such as basemap and ax (mpl_toolkits.basemap.Basemap object and matplotlib.axes object respectively), which define the axis and the underlying map, and other attributes that affect how the data will be plotted, such as colorbar options, domain, projection, title, etc.
A Geofield object defines how the plotted field will look. It contains attributes such as the data, plotting levels, fill/contour colors, etc.
Using these two objects a geospatial plot can be created. First import the dependencies:
>>> from cpc.geogrids import Geogrid
>>> from cpc.geoplot import Geomap, Geofield
Next create a Geomap:
geomap = Geomap()
Then load the data:
import numpy as np
data = np.fromfile('/path/to/files/observation.bin', dtype='float32')
Then create a Geofield (which needs a Geogrid):
geogrid = Geogrid('1deg-global')
geofield = Geofield(data, geogrid)
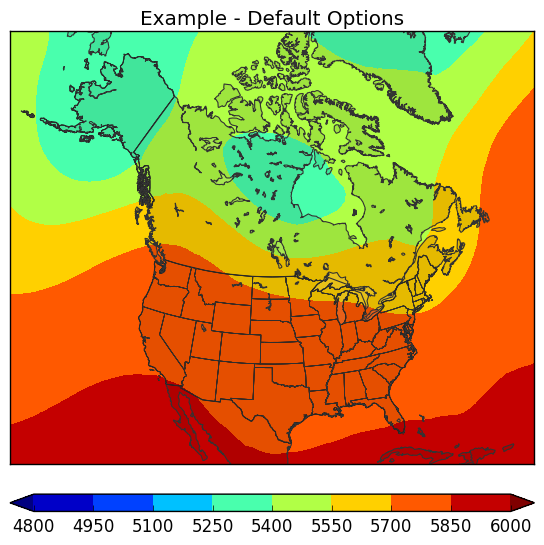
Finally plot the data and save it:
geomap.plot(field)
geomap.save('out.png', dpi=100)
Here’s the result:
Options
Geomap options
The following options are available as parameters when calling Geomap():
projection- map projection (to get a list of supported projections callcpc.geoplot.Geomap().get_supported_projections(), defaults to equal-area)domain- map domain (to get a list of supported domains callcpc.geoplot.Geomap().get_supported_domains(), defaults to US)cbar- whether to plot the colorbar (defaults to True unless the first Geofield plotted hasfill_colors=False)cbar_ends- type of colorbar ends (triangular [first and last colors indicate less than and greater than, respectively] or square, defaults to triangular)cbar_type- type of colorbar (normal or tercile [below, near, and above normal/median/etc.], defaults to normal)cbar_color_spacing- how colors are spaced on the colorbar (currently non-functional, will be implemented)cbar_label- label for the colorbar (defaults to an empty string)cbar_tick_labels- list of labels for the colorbar ticks (defaults to None, which leads to the colorbar being automatically labelled)tercile_type- type of tercile (affects labelling of the colorbar only, use something like normal or median)title- plot title (defaults to empty string, which results in no title being plotted)
Geofield options
The following options are available as parameters when calling Geofield():
levels- list of levels to contour/fill (defaults to auto, which results in the levels being automatically specified bymatplotlib.pyplot.contour[f]())contour_colors- matplotlib color(s) (named color like r, red, black, etc., color tuples, or HEX colors) - can be a single color or a list of colors to cycle throughcontour_labels- whether to label contors (defaults to False)smoothing_factor- level of smoothing to apply to the data before plotting (0 means to smoothing, then any float for smoothing - higher values means more smoothing)fill_colors- matplotlib color(s) (named color like r, red, black, etc., color tuples, or HEX colors) - can be a single color or a list of colors to cycle throughfill_coastal_vals- whether to fill missing coastal values (usually found in course datasets) - essentially extends the data so that it covers points near the coast (really any points near a mask boundary, but coastal values are the most common, especially in coarse datasets) (defaults to False)